
Parity/Mediocrity
Po-tay-toe, po-tah-to. They are one and the same, and the word you choose depends on which way you want to spin it. But how do you measure it?
Darryl Shilling's Hockey Project introduced the Competitive Balance to compare the league from one year to the next. It is simply the standard deviation of the win% of all the teams. The lower the CB, the greater the parity.
I cobbled together this chart of the CB from 1980 to present (click for full size).
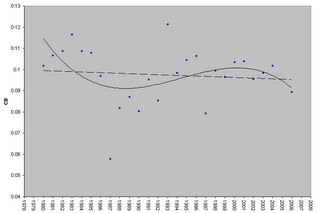
Because of the new OT format, I used the pyth. win% rather than the actual win%. It's easier that way, and the pyth. win% is supposed to be a better measure of team strengths anyway.
The dashed line is a linear trend - the league has been drifting toward more parity. The solid line is a 3rd order polynomial. It nicely illustrates the drop in CB in the years following the WHA merger, then the gradual rise over the 90s expansion, and finally the drop since the most recent expansion in 2000.
The 2006 season has been a little tighter than most recent years, but it's not exactly off the charts in terms of parity/mediocrity. And I don't recall anyone complaining about how sucky the '87, '90 or '97 seasons were.
~~~
Now that I've put all this work into using the CB to evaluate league parity, I'm going to pick the theory apart.
The CB does tell us that the pre-expansion NHL is more competitive than the (immediately) post-expansion NHL. That's fine - we all agree that expansion fodder reduces league-wide competitiveness for a few seasons. Now, THP uses CB to measure teams against one another across seasons. I will agree that this works if the league is zero-sum. That is, a trade can affect the competitiveness of the league, but does not change the overall quality. However, player transactions are not zero-sum.
I.e. Imagine a league where there are three great teams (.750 win%), three terrible ones (.250), and 24 mediocre (.500) ones. This league has a CB of .114. Now, say two top teams make a trade with each other, and it backfires badly for both. Say the trade makes them equal to the 24 mediocre teams. Since win% is zero sum (the top team is still 3x better than a bottom-feeder, and 1.5x better than a middling team), the top team will now be .776, the mediocre teams will be .517 (twice as good as a bottom feeder) and the bottom teams are .259. This league has a CB of .094.
Two teams got worse and the other 28 stayed the same. Clearly, the post-trade league is of less overall quality than the pre-trade league, although it is more competitive according to the CB. The Pythagorean Dominance of the top teams pre-trade is 2.198. Post-trade, the exact same team is rated at 2.921. That's a huge difference.
Of course, some player transactions are mutually beneficial. If you want to assume that player movement washes out in the end - the mutually beneficial transactions balance the number of mutually destructive transactions - I'm fine with that. Still, it should be apparent that the CB measure is not perfect. Leagues with the same collection of players can be better or worse, depending on their distribution, because team building is a crapshoot.
Real stats pros out there, please criticize.
Darryl Shilling's Hockey Project introduced the Competitive Balance to compare the league from one year to the next. It is simply the standard deviation of the win% of all the teams. The lower the CB, the greater the parity.
I cobbled together this chart of the CB from 1980 to present (click for full size).
Because of the new OT format, I used the pyth. win% rather than the actual win%. It's easier that way, and the pyth. win% is supposed to be a better measure of team strengths anyway.
The dashed line is a linear trend - the league has been drifting toward more parity. The solid line is a 3rd order polynomial. It nicely illustrates the drop in CB in the years following the WHA merger, then the gradual rise over the 90s expansion, and finally the drop since the most recent expansion in 2000.
The 2006 season has been a little tighter than most recent years, but it's not exactly off the charts in terms of parity/mediocrity. And I don't recall anyone complaining about how sucky the '87, '90 or '97 seasons were.
~~~
Now that I've put all this work into using the CB to evaluate league parity, I'm going to pick the theory apart.
The CB does tell us that the pre-expansion NHL is more competitive than the (immediately) post-expansion NHL. That's fine - we all agree that expansion fodder reduces league-wide competitiveness for a few seasons. Now, THP uses CB to measure teams against one another across seasons. I will agree that this works if the league is zero-sum. That is, a trade can affect the competitiveness of the league, but does not change the overall quality. However, player transactions are not zero-sum.
I.e. Imagine a league where there are three great teams (.750 win%), three terrible ones (.250), and 24 mediocre (.500) ones. This league has a CB of .114. Now, say two top teams make a trade with each other, and it backfires badly for both. Say the trade makes them equal to the 24 mediocre teams. Since win% is zero sum (the top team is still 3x better than a bottom-feeder, and 1.5x better than a middling team), the top team will now be .776, the mediocre teams will be .517 (twice as good as a bottom feeder) and the bottom teams are .259. This league has a CB of .094.
Two teams got worse and the other 28 stayed the same. Clearly, the post-trade league is of less overall quality than the pre-trade league, although it is more competitive according to the CB. The Pythagorean Dominance of the top teams pre-trade is 2.198. Post-trade, the exact same team is rated at 2.921. That's a huge difference.
Of course, some player transactions are mutually beneficial. If you want to assume that player movement washes out in the end - the mutually beneficial transactions balance the number of mutually destructive transactions - I'm fine with that. Still, it should be apparent that the CB measure is not perfect. Leagues with the same collection of players can be better or worse, depending on their distribution, because team building is a crapshoot.
Real stats pros out there, please criticize.
posted by Jeff J at 4:01 p.m.
![]()
![]()

0 Comments:
Post a Comment
<< Home