
Great Expectorations
If you can believe it, the Expected Goals in this series favour the Flyers 13.3 to 10.5. That just can't be right.
Not including the subjective but universal opinion that MTL has dominated on scoring chances, I believe there are two factors in play here that incorrectly tilt the EGF toward PHI.
1 - Leads. According to Javageek, shots while leading are higher probability chances. In a way that makes sense because the trailing team is more likely to take chances. However, breaking down shot probabilities by leading/trailing situations adds bias to the data. Good teams take leads more often than bad teams, and bad teams trail more often than good teams. When a bad team has a lead their EGF will receive an unfair boost on all shots, and vice versa for good teams that are trailing. Montreal has not had a shot on goal while leading for the entire series.
2 - Shot angle. This is not accounted for in the EGF calculation. Only distance matters, and that is a distance to the back boards - not the direct line distance to the net. Not only does the number of shots heavily favour Montreal, but I think the shot locations are on their side too.
Here are the shot charts from ESPN for all four games:
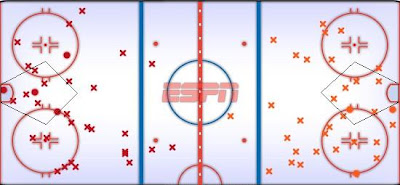

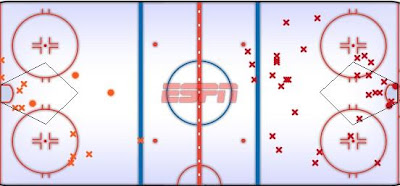

The Flyers are being rewarded in terms of EGF by taking bad angle shots from along the goal line.
Now, Gabriel Desjardins of Behindthenet fame actually plucks this shot information (see this post, which even mentions Ryder) and builds some outstanding goal probability charts. Here is the chart for 5 on 5 play.

The 5 on 4 situation chart can be found here.
Driven to the brink of insanity by the last three games, I actually went to the trouble of cutting a little pentagonal hole in a piece of paper and held it over the ESPN charts to count dangerous shots. The lines in the charts above are an approximation of my cutout.
Now for the totals.
7 - 6 in g1
14- 4 in g2
10- 5 in g3
11- 7 in g4
-----
42-22 total.
Shots within the pentagon are 35-16 in the 3 losses. This would be a rout if it weren't for Biron. And his big fat goalposts.
Not including the subjective but universal opinion that MTL has dominated on scoring chances, I believe there are two factors in play here that incorrectly tilt the EGF toward PHI.
1 - Leads. According to Javageek, shots while leading are higher probability chances. In a way that makes sense because the trailing team is more likely to take chances. However, breaking down shot probabilities by leading/trailing situations adds bias to the data. Good teams take leads more often than bad teams, and bad teams trail more often than good teams. When a bad team has a lead their EGF will receive an unfair boost on all shots, and vice versa for good teams that are trailing. Montreal has not had a shot on goal while leading for the entire series.
2 - Shot angle. This is not accounted for in the EGF calculation. Only distance matters, and that is a distance to the back boards - not the direct line distance to the net. Not only does the number of shots heavily favour Montreal, but I think the shot locations are on their side too.
Here are the shot charts from ESPN for all four games:


The Flyers are being rewarded in terms of EGF by taking bad angle shots from along the goal line.
Now, Gabriel Desjardins of Behindthenet fame actually plucks this shot information (see this post, which even mentions Ryder) and builds some outstanding goal probability charts. Here is the chart for 5 on 5 play.

The 5 on 4 situation chart can be found here.
Driven to the brink of insanity by the last three games, I actually went to the trouble of cutting a little pentagonal hole in a piece of paper and held it over the ESPN charts to count dangerous shots. The lines in the charts above are an approximation of my cutout.
Now for the totals.
7 - 6 in g1
14- 4 in g2
10- 5 in g3
11- 7 in g4
-----
42-22 total.
Shots within the pentagon are 35-16 in the 3 losses. This would be a rout if it weren't for Biron. And his big fat goalposts.
posted by Jeff J at 11:43 a.m.
![]()
![]()

2 Comments:
Great post. I just found this blog via your "Great Expectations" post. Keep up the great work.
Even though Javageek may have said that leading teams tend to take higher quality shots, are you sure that leading vs. trailing in a game is taken into account in the actual shot quality model? You should find out, because I'd be surprised if it was.
Also, seeing the shot charts from the four games, as well as the behindthenet grid, is pretty cool. But I don't quite understand the numbers you tally after that. Are you just counting shots within the pentagon? Won't shots within the pentagon differ in terms of goal expectation, depending on how close in the pentagon they are to the goal, as well as what type of shot they are? (wrist shot, slap shot, deflection, etc)
While all this shot quality stuff is putting hockey stats on the right path, and is certainly the way of the future, the biggest problem right now is the huge amount of error. The shot quality model itself is extremely crude, and on top of that there is data recording bias, etc. Javageek had to futz with it a few times throughout the season to try and tweak out some of the error. And even now, I'd be pretty surprised if that EGF for San Jose's season is correct. It seems to be off by several standard deviations.
In any case, great post. Keep 'em coming.
...are you sure that leading vs. trailing in a game is taken into account in the actual shot quality model?
I asked here
and he replied:
"I consider shots by the winning team (1 or 2 goals up) to have a better chance of going in. (I bet some people would disagree with this)."
I would accept it if it could be demonstrated that the effect is real for both good and bad teams when playing against both good and bad teams.
Are you just counting shots within the pentagon?
Yes. I was just looking for something to reconcile the EGF numbers (favouring Philly slightly) with the huge shot/chance count discrepancy (favouring Mtl by a lot). It is abolutely arbitrary, but I think if you look at shots grouped within any arbitrary distance Montreal comes out ahead. The shot types matter a little bit, but there isn't a drastic difference between the two teams in shot types. The games I looked at closely had shots off rebounds (high probability) favouring Mtl.
Javageek's SQ model uses the distances in the play by play tables. They are a distance to the end boards, not the net. That means the model sees a shot from inside the crease one foot away from the goal line the same as a shot from the corner of the rink one foot away from the goal line. Just by eyeballing the ESPN charts, I think the Flyers have been taking more shots from bad angles down low, which would exaggerate their EGF.
Incidentally, another commenter just discovered these xml files from espn. They include the shot coordinates, not just the distance to the end boards. I think these are what Desjardins used for his grid. I passed the find onto Javageek.
Yeah, the San Jose thing is odd. Maybe their stats counters see a lot more tip-ins than the norm.
Post a Comment
<< Home