
Puck Luck
They're off to a good start. Still, Habsland has this nagging feeling. The ominous shadow of last season hangs over this team. They were off to an even better start in 2006 when the wheels fell off. We can blame 2006-07 Maple Leafs MVP c difficile all we want, but deep down we all know they were doing it with smoke and mirrors.
The $64,000 question is, Will the same thing happen this year? Let's pop the hood and look for some warning signs through the first 24 games.
1. Even Strength
All stats in this post are from behindthenet.
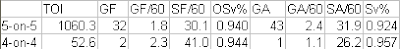
I'm only including the 4-on-4 info for the sake of completeness. It's irrelevant compared to 5-on-5.
First off, the +32/-43 in 5-on-5 play looks like trouble. It's eerily reminiscent of last year. Good teams don't get outscored 4:3 at even strength. The shot differential is negative, but it's nowhere near this 4:3 ratio. They're only being outshot by 1.3 shots per game, 5-on-5.
If you look a little closer, you'll find the Save percentages are the difference. The league average EV Sv% is .916 (calculated by adding up each team's Sv% and dividing by 30). As expected, Huet and Price are above average at .924. Montreal shooters have been making opposing goalies look like Tretiak. Collectively, they have had a .940 Sv% - the Habs have been shooting 6% at ES. Only the Rangers have been worse, at 5.4%. I can accept that Montreal shooters are below average, but this looks suspiciously like a run of bad puck luck.
What if we plug in some numbers to account for the bad luck? If opposing teams merely had the same kind of goaltending Huet/Price provided at ES (a solid .924 Sv%), Montreal still would have scored an additional 8 goals. I think it's fair to keep the Habs' .924 Sv% as is - goaltending is a team strength. Here's the revised table:
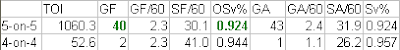
If Montreal could shoot a below-average 7.6% rather than an abysmal 6%, they would only be outscored 40:43 at ES. If they could shoot at a league-average 8.4%, they would be outscoring opposition 45-43. But let's not get carried away. Shooting 7.6% is a reasonable goal for a team comprised of four 4th lines.
Puck luck at even strength: Unlucky by 8 goals (-8)
2. Power Play
It's a different story on the PP - shooting percentages are abnormally high.

League average Sv% are .870 for 5-on-4 and .750 for 5-on-3. As unlucky as the Habs have been at ES, they've been extremely lucky on the PP. We can be pretty sure that the Habs PP is good, this being it's second successful year in a row, so we'll grant them a 5-on-4 Opposition Sv% of .850. That's still a lot better than average, but you have to consider that had they not scored on some of those 'lucky' shots, the PP would have continued and they would have had more shots.

Puck luck on the PP: Lucky by 4 goals (+4)
3. Penalty Kill
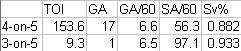
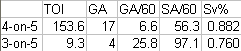
Things look normal for the 4-on-5 penalty kill. League average Sv% is .870 - Price/Huet performing at .882 is reasonable. The 3-on-5 Sv% is way out of whack. They're giving up fewer goals per minute when down two men than when they're down one. Those numbers will change by the end of the season. A .760 Sv% is more reasonable for 3-on-5 situations. With some rounding, that means 4GA rather than 1.
Puck luck on the PK: +3 goals, all 5-on-3
3a. SHGs
The other piece of puck luck on special teams is the 4 shorties scored and none allowed. Last season, the Habs scores 15 and allowed 5. There is probably some repeatability there, but not the 3:1 ratio. I'll use a completely arbitrary and unjustifiable 4:3 ratio as reasonable. This means the Habs are up another 3 goals here due to luck.
Puck luck with SHGs: +3 goals
4. Penalties taken/drawn
On average, Montreal is on the PP for 7.6 minutes per game and spending only 6.8 minutes on the PK per game. The success of the PP means that the difference between penalties drawn/taken is even greater. This is a huge improvement over last season, and it's a bit of a wild card. I'm not optimistic that they'll be able to sustain this, but then again I'm wrong an awful lot.
If the Habs conformed to the league average, they would have been on both the PP and PK for an equal 7.3 minutes per game. This would have resulted in a 2 goal swing downward - instead of scoring 4 more PPGs than their opposition, it would be down to a +2. However, I'm going to call this one a wash because they just might be able to continue drawing more penalties than they commit.
Puck luck on penalty differential: 0
5. Empty net goals
They've scored 3 and allowed 4.
Puck luck on ENGs: -1 goal
6. Goalposts
As of Nov. 23, the publication date of this post at IOF, opponents hit seven more posts than did the Habs.
I don't know what to make of this. There is some debate regarding the accuracy of the stats. No one calls shots that go off a post and into the net 'lucky' for the shooter, but shots that hit the post and stay out are somehow 'lucky' for the goalie. There must be some number of goalposts hit that would have been saves if the shot had been aimed an inch or two closer to the centre of the net. Intuitively, something tells me the luck value of a goalpost is not more than half a goal. I'll call the -7 goalpost differential equivalent to 3 goals worth of luck. I'll allocate two of those to 5-on-5 and one to 4-on-5.
Posts: +3 goals.
Total: Habs have been lucky by 4 goals. Instead of a +7 differential (69GF, 62GA) in these situations, we should have expected only +3 (73GF, 70GA). They may not be quite as good as their record indicates, but they're not a sub-.500 team either. As long as no major injuries strike, everyone gets their flu shot and there are no lengthy skids of bad luck, they should stay above .500 and make the playoffs.

Update: It looks like I might have double counted a shorthanded empty net goal. It doesn't change the conclusion much - the good luck on the PP and 3-on-5 PK has been countered by rotten luck scoring at 5-on-5. The team should be able to maintain a slight positive goal differential.
The $64,000 question is, Will the same thing happen this year? Let's pop the hood and look for some warning signs through the first 24 games.
1. Even Strength
All stats in this post are from behindthenet.

I'm only including the 4-on-4 info for the sake of completeness. It's irrelevant compared to 5-on-5.
First off, the +32/-43 in 5-on-5 play looks like trouble. It's eerily reminiscent of last year. Good teams don't get outscored 4:3 at even strength. The shot differential is negative, but it's nowhere near this 4:3 ratio. They're only being outshot by 1.3 shots per game, 5-on-5.
If you look a little closer, you'll find the Save percentages are the difference. The league average EV Sv% is .916 (calculated by adding up each team's Sv% and dividing by 30). As expected, Huet and Price are above average at .924. Montreal shooters have been making opposing goalies look like Tretiak. Collectively, they have had a .940 Sv% - the Habs have been shooting 6% at ES. Only the Rangers have been worse, at 5.4%. I can accept that Montreal shooters are below average, but this looks suspiciously like a run of bad puck luck.
What if we plug in some numbers to account for the bad luck? If opposing teams merely had the same kind of goaltending Huet/Price provided at ES (a solid .924 Sv%), Montreal still would have scored an additional 8 goals. I think it's fair to keep the Habs' .924 Sv% as is - goaltending is a team strength. Here's the revised table:

If Montreal could shoot a below-average 7.6% rather than an abysmal 6%, they would only be outscored 40:43 at ES. If they could shoot at a league-average 8.4%, they would be outscoring opposition 45-43. But let's not get carried away. Shooting 7.6% is a reasonable goal for a team comprised of four 4th lines.
Puck luck at even strength: Unlucky by 8 goals (-8)
2. Power Play
It's a different story on the PP - shooting percentages are abnormally high.

League average Sv% are .870 for 5-on-4 and .750 for 5-on-3. As unlucky as the Habs have been at ES, they've been extremely lucky on the PP. We can be pretty sure that the Habs PP is good, this being it's second successful year in a row, so we'll grant them a 5-on-4 Opposition Sv% of .850. That's still a lot better than average, but you have to consider that had they not scored on some of those 'lucky' shots, the PP would have continued and they would have had more shots.

Puck luck on the PP: Lucky by 4 goals (+4)
3. Penalty Kill

Things look normal for the 4-on-5 penalty kill. League average Sv% is .870 - Price/Huet performing at .882 is reasonable. The 3-on-5 Sv% is way out of whack. They're giving up fewer goals per minute when down two men than when they're down one. Those numbers will change by the end of the season. A .760 Sv% is more reasonable for 3-on-5 situations. With some rounding, that means 4GA rather than 1.

Puck luck on the PK: +3 goals, all 5-on-3
3a. SHGs
The other piece of puck luck on special teams is the 4 shorties scored and none allowed. Last season, the Habs scores 15 and allowed 5. There is probably some repeatability there, but not the 3:1 ratio. I'll use a completely arbitrary and unjustifiable 4:3 ratio as reasonable. This means the Habs are up another 3 goals here due to luck.
Puck luck with SHGs: +3 goals
4. Penalties taken/drawn
On average, Montreal is on the PP for 7.6 minutes per game and spending only 6.8 minutes on the PK per game. The success of the PP means that the difference between penalties drawn/taken is even greater. This is a huge improvement over last season, and it's a bit of a wild card. I'm not optimistic that they'll be able to sustain this, but then again I'm wrong an awful lot.
If the Habs conformed to the league average, they would have been on both the PP and PK for an equal 7.3 minutes per game. This would have resulted in a 2 goal swing downward - instead of scoring 4 more PPGs than their opposition, it would be down to a +2. However, I'm going to call this one a wash because they just might be able to continue drawing more penalties than they commit.
Puck luck on penalty differential: 0
5. Empty net goals
They've scored 3 and allowed 4.
Puck luck on ENGs: -1 goal
6. Goalposts
As of Nov. 23, the publication date of this post at IOF, opponents hit seven more posts than did the Habs.
I don't know what to make of this. There is some debate regarding the accuracy of the stats. No one calls shots that go off a post and into the net 'lucky' for the shooter, but shots that hit the post and stay out are somehow 'lucky' for the goalie. There must be some number of goalposts hit that would have been saves if the shot had been aimed an inch or two closer to the centre of the net. Intuitively, something tells me the luck value of a goalpost is not more than half a goal. I'll call the -7 goalpost differential equivalent to 3 goals worth of luck. I'll allocate two of those to 5-on-5 and one to 4-on-5.
Posts: +3 goals.
Total: Habs have been lucky by 4 goals. Instead of a +7 differential (69GF, 62GA) in these situations, we should have expected only +3 (73GF, 70GA). They may not be quite as good as their record indicates, but they're not a sub-.500 team either. As long as no major injuries strike, everyone gets their flu shot and there are no lengthy skids of bad luck, they should stay above .500 and make the playoffs.

Update: It looks like I might have double counted a shorthanded empty net goal. It doesn't change the conclusion much - the good luck on the PP and 3-on-5 PK has been countered by rotten luck scoring at 5-on-5. The team should be able to maintain a slight positive goal differential.
posted by Jeff J at 4:27 p.m.
3 comments
![]()
![]()


